The Settings Screen
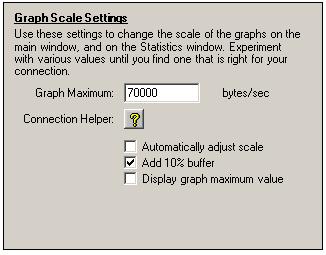
Graph Scale Settings

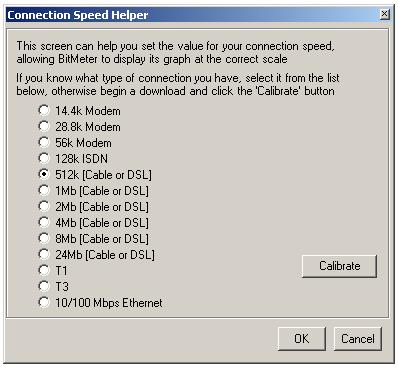
The Graph Maximum value should be set according to the speed of your internet/network connection. If you know your connection speed then enter it here, in bytes per second. If you are not sure what speed your connection is, then click the Connection Speed Helper button that will display the following screen

If you recognise your connection type in the list then simply select it, and click OK. If you do not know what type of connection you have, then Bitmeter can try to determine the appropriate speed for you. Clicking the Calibrate button will cause Bitmeter to monitor your connection speed for 30 seconds; at the end of this time the maximum speed attained will be used as the value for your connection. While this calibration is being performed you should ensure that your connection is in use, and that data is being transferred - this can be achieved by browsing the web, or downloading files from a server or other source. You may wish to repeat this process a few times, downloading from a number of sources, to achieve the most accurate measurement.
The Automatically adjust scale option will cause Bitmeter to dynamically alter the vertical scale of the graph according to your current upload and download speed.
The Add 10% buffer option makes the vertical scale of the graph a little higher than the maximum speed entered, and should prevent occasional 'spikes' disappearing off the top of the display
If the Display graph maximum value option is selected, then the speed represented by the top of the graph window (ie the speed at which a bar would reach the top of the main graph) is displayed, in the top right-hand corner of the screen; this feature can be useful if Automatically adjust scale is also selected.
| << back |  |
next >> |